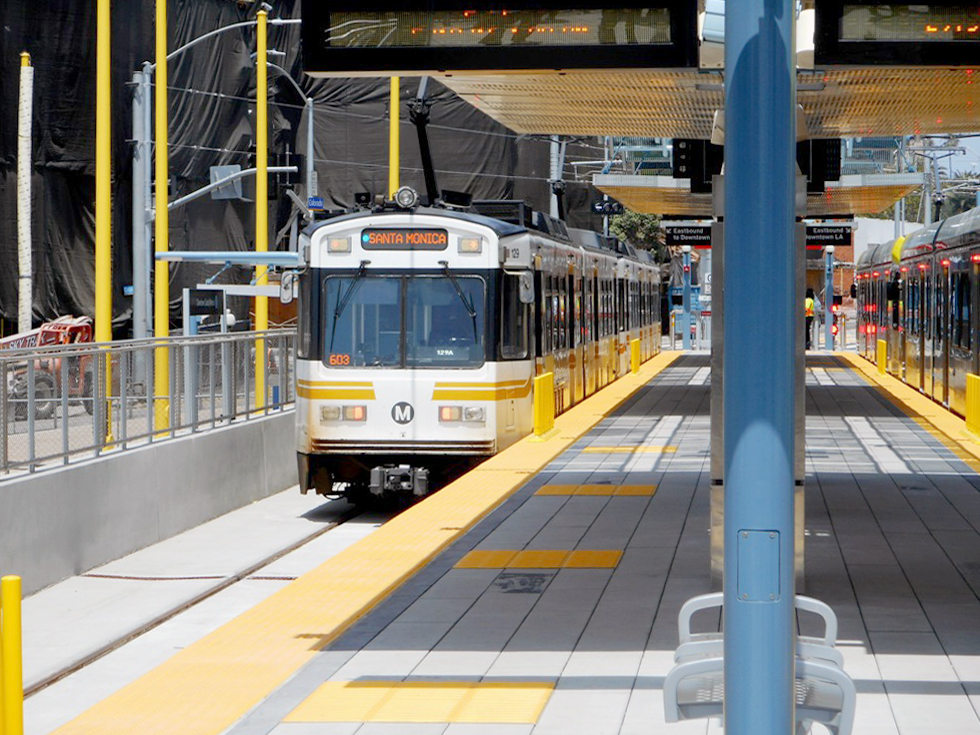
The completion of the LA Metro's Expo Line extension to Santa Monica in May 2016 brought passenger rail back to the Westside.
Already, the Expo Line extension has led to increased ridership and been shown to decrease vehicle use in nearby househoulds.
The arrival of light rail into Santa Monica did, however, prompt questions around a possible increase in crime. We were asked by the City of Santa Monica to explore the impact, if any, of the extension of the LA Metro Expo Line into Santa Monica on crime.
Our primary data source was the Police Incidents dataset available on Santa Monica's open data portal. We removed all data points that either did not have a date or location (latitude and/or longitude). While the number of datapoints removed was relatively small (~2,000 out of 100,000+), the removed data points were more heavily weighted towards events after the Expo Line's opening as compared to the overall dataset.
We also looked at the Police Calls for Service dataset to confirm some of the trends we were seeing in the incidents database, but ultimately did not incorporate that data into the final analysis.
In order to better understand the underlying trends in the noisy crimes per day data, we used an additive time series decomposition approach.
As you can see on the right, once seasonality and randomness (not shown) are removed from the actual time series data, the data indicates an increasing trend in larceny incidents after the expo line opened, though this trend was already increasing before the line's opening.
This trend line is less clear for all crimes, indicating that at least part of the increase in larceny was offset by a decrease in a number of other crime types.
We decided to take a closer look at larceny in particular as the initial trend appeared to show some relationship with the opening of the Expo Line and the crime itself is associated with the petty crime one might expect around metro stations.
Difference in Means (Daily)
| All Santa Monica | Within Half Mile | Outside Half Mile | ||
| Incident Type | Total | 1.10*** | 1.21*** | -0.10 |
| Violent | 0.13 | 0.18** | -0.05 | |
| Non-Violent | 0.99* | 1.03*** | -0.04 | |
| Larceny | 1.46*** | 0.99*** | 0.48** |
To test if there was a statistically significant difference in the number of daily crimes one year before vs. one year after the Expo Line opened, we used a paired t-test.
As the table shows there are statistically significant increases in non-violent crime, in particular larceny. These differences are higher within a half mile radius of the line when compared to areas outside of the half mile radius.
To assess the change in crime over time in the context of geography, we ran a series of statistical paired t-tests on an analysis grid, where the unit of analysis cooresponded to a square area one-hundredth of a decimal degree in length. The tests compared the distribution over time of crimes in the area of analysis for a year prior to the opening of the expo line, against the distribution over time of crimes for a year after opening
In the map to the left, statistically significant p-value results from the t-test are shown in yellow — meaning the difference in crime was more likely to not be caused by random variance. The spatial distribution of signficant changes in crime suggest there might be some relationship between the location of Expo line stations and cooresponding crime around those stations and the beach.
We used standard time series forecasting models to compare crime per day forecasts after the Expo Line opening to the actual trends. If the difference between the forecasted and actual trends was large enough, this could indicate a change in trend as a result of the Expo Line Opening.
The two models we used were a SARIMA (Seasonal Autoregressive Integrated Moving Average) model and a Prophet model, which is an additive regression model developed by Facebook.
While the charts illustrate a large residual between the model forecasts and actual trends, neither are statistically significant given the model fits more generally. In addition, none of the Prophet model “change points” corresponded with the Expo Line opening.
While there are indications that non-violent crime, in particular larceny, increased after the opening of the Expo Line, the actual link between the line and these crimes is unclear.
Statistical t-tests do show a significant difference in certain types of crimes per day one year after the opening of the line as compared to one year before. Additionally, these differences appear to be stronger in regions closer to the Expo Line stations.
However, when analyzing the actual crime trends using both additive decomposition and forecasting models like SARIMA and Prophet, little evidence emerges of a link between the line opening and crime rate increases.
Overall, data on the residence of both those people who commit the crime and are victims of it would help illuminate the issue, however this data is highly sensitive it available at all.
The HKS Data Science Group is a group of students that helps public sector organizations with their data science and machine learning problems.
All code and analysis can be found in our Github repo.
If you're an organization looking for help, please reach out to ihsaan_patel@hks18.harvard.edu.
If you're a student looking to get involved, visit our website.